数据结构分析
参考快速启动中的返回结果示例(prompt模式返回节选部分),文档抽取API的返回结果中包含了以下坐标关键信息:- position表示相关坐标信息,pages中有页面相关信息。
{
  "result": {
    "raw_json": {
      "实付金额": {
        "bounding_regions": [
          {
            "position": [812, 802, 878, 802, 878, 843, 812, 843],
            "page_id": 1,
            "value": "158.00"
          }
        ]
      }
    },
    "pages": [
      {
        "width": 1279,
        "height": 1706,
        "page_id": 1
      }
    ]
  }
}
坐标系统说明
抽取API返回的坐标格式为:[x1, y1, x2, y2, x3, y3, x4, y4] 这表示一个四边形的四个顶点坐标,按顺时针排列:坐标数组: [x1, y1, x2, y2, x3, y3, x4, y4]
↑左上 ↑右上 ↑右下 ↑左下
"position": [812, 802, 878, 802, 878, 843, 812, 843]
定义坐标提取函数
import json
from typing import List, Dict, Any

def extract_coordinates_from_extract_result(extract_result: Dict[str, Any]) -> List[List[Dict[str, Any]]]:
    """
    从抽取API返回结果中提取每页的坐标信息

    Args:
        extract_result: 抽取API返回的完整结果

    Returns:
        二维数组,每个元素包含该页的所有坐标信息
        格式: [[page1_coords], [page2_coords], ...]
    """

    if 'result' not in extract_result:
        print("警告: 未找到result字段")
        return []

    result = extract_result['result']
    pages_coordinates = []

    # 获取页面信息
    pages_info = {}
    if 'pages' in result:
        for page in result['pages']:
            page_id = page.get('page_id', 1)
            pages_info[page_id] = {
                'width': page.get('width', 0),
                'height': page.get('height', 0)
            }

    # 从raw_json字段提取坐标信息
    if 'raw_json' in result:
        pages_dict = {}

        for field_name, field_data in result['raw_json'].items():
            if 'bounding_regions' in field_data and field_data['bounding_regions']:
                for region in field_data['bounding_regions']:
                    page_id = region.get('page_id', 1)
                    if page_id not in pages_dict:
                        pages_dict[page_id] = []

                    # 提取坐标信息
                    if 'position' in region:
                        coord_info = {
                            'field_name': field_name,
                            'text': region.get('value', ''),
                            'position': region['position'],
                            'page_id': page_id,
                            'type': 'extracted_field'
                        }
                        pages_dict[page_id].append(coord_info)

        # 转换为二维数组,按页码排序
        max_page = max(pages_dict.keys()) if pages_dict else 0
        for page_id in range(1, max_page + 1):
            pages_coordinates.append(pages_dict.get(page_id, []))

    return pages_coordinates
坐标可视化绘制器
from PIL import Image, ImageDraw, ImageFont
import os
from typing import List, Dict, Any

class ExtractCoordinateDrawer:
    """抽取结果坐标框绘制器"""

    def __init__(self, image_path: str, coordinates: List[List[Dict[str, Any]]]):
        """
        初始化绘制器

        Args:
            image_path: 图片文件路径
            coordinates: 坐标信息二维数组
        """
        self.image_path = image_path
        self.coordinates = coordinates

    def draw_coordinates_on_image(self, page_coordinates: List[Dict[str, Any]],
                                 output_path: str = None, show_text: bool = True,
                                 line_width: int = 3, font_size: int = 16) -> str:
        """
        在图片上绘制坐标框

        Args:
            page_coordinates: 该页的坐标信息
            output_path: 输出路径
            show_text: 是否显示文本
            line_width: 线条宽度
            font_size: 字体大小

        Returns:
            输出图片路径
        """
        if output_path is None:
            output_path = self.image_path.replace('.png', '_annotated.png')

        # 打开图片
        image = Image.open(self.image_path)
        draw = ImageDraw.Draw(image)

        # 定义颜色映射
        colors = {
            '实付金额': (255, 0, 0),      # 红色
            '消费日期': (0, 255, 0),      # 绿色
            '店铺名称': (0, 0, 255),      # 蓝色
            '订单号': (255, 255, 0),      # 黄色
            '货号': (255, 0, 255),        # 紫色
            '商品名称': (0, 255, 255),    # 青色
            '数量': (255, 165, 0),        # 橙色
            '单价': (128, 0, 128)         # 深紫色
        }

        # 绘制每个坐标框
        for coord_info in page_coordinates:
            position = coord_info['position']
            field_name = coord_info['field_name']
            text = coord_info['text']

            # 获取颜色
            color = colors.get(field_name, (128, 128, 128))

            # 绘制矩形框
            points = [
                (position[0], position[1]),  # 左上
                (position[2], position[3]),  # 右上
                (position[4], position[5]),  # 右下
                (position[6], position[7])   # 左下
            ]

            # 绘制边框
            for i in range(4):
                start_point = points[i]
                end_point = points[(i + 1) % 4]
                draw.line([start_point, end_point], fill=color, width=line_width)

            # 显示文本
            if show_text:
                try:
                    font = ImageFont.truetype("arial.ttf", font_size)
                except:
                    font = ImageFont.load_default()

                # 在框上方显示字段名和值
                label = f"{field_name}: {text}"
                bbox = draw.textbbox((0, 0), label, font=font)
                text_width = bbox[2] - bbox[0]
                text_height = bbox[3] - bbox[1]

                # 计算文本位置(在框的上方)
                text_x = position[0]
                text_y = position[1] - text_height - 5

                # 绘制文本背景
                draw.rectangle([
                    text_x - 2, text_y - 2,
                    text_x + text_width + 2, text_y + text_height + 2
                ], fill=(255, 255, 255))

                # 绘制文本
                draw.text((text_x, text_y), label, fill=color, font=font)

        # 保存图片
        image.save(output_path)
        return output_path

    def create_legend(self, output_path: str = "legend.png"):
        """创建图例"""
        legend_height = 300
        legend_width = 400

        legend_image = Image.new('RGB', (legend_width, legend_height), (255, 255, 255))
        draw = ImageDraw.Draw(legend_image)

        colors = {
            '实付金额': (255, 0, 0),
            '消费日期': (0, 255, 0),
            '店铺名称': (0, 0, 255),
            '订单号': (255, 255, 0),
            '货号': (255, 0, 255),
            '商品名称': (0, 255, 255),
            '数量': (255, 165, 0),
            '单价': (128, 0, 128)
        }

        try:
            font = ImageFont.truetype("arial.ttf", 14)
        except:
            font = ImageFont.load_default()

        y_offset = 20
        for field_name, color in colors.items():
            # 绘制颜色示例
            draw.rectangle([20, y_offset, 40, y_offset + 20], fill=color, outline=(0, 0, 0))
            draw.text((50, y_offset), field_name, fill=(0, 0, 0), font=font)
            y_offset += 30

        legend_image.save(output_path)
        return output_path
主函数使用示例
- 确保抽取结果json文件和原始图片在指定路径。
- 生成的图片为 annotated_extract_result.png 和 legend.png。
def main():
    """主函数示例"""

    # 配置参数,替换原始图片地址和抽取结果json文件地址
    IMAGE_PATH = "65a27abc197e4ffe8cdc171c49.png"
    EXTRACT_RESULT_FILE = "prompt_extract_result.json"

    # 1. 加载抽取结果
    print("正在加载抽取结果...")
    with open(EXTRACT_RESULT_FILE, 'r', encoding='utf-8') as f:
        extract_result = json.load(f)

    # 2. 提取坐标信息
    print("正在提取坐标信息...")
    coordinates = extract_coordinates_from_extract_result(extract_result)
    print(f"提取到 {len(coordinates)} 页的坐标信息")

    # 3. 创建绘制器
    drawer = ExtractCoordinateDrawer(IMAGE_PATH, coordinates)

    # 4. 绘制坐标框
    print("正在绘制坐标框...")
    if coordinates and coordinates[0]:  # 如果有第一页的坐标
        annotated_image = drawer.draw_coordinates_on_image(
            coordinates[0],
            output_path="./annotated_extract_result.png",
            show_text=True
        )
        print(f"标注后的图片保存为: {annotated_image}")

    # 5. 创建图例
    legend_path = drawer.create_legend()
    print(f"图例保存为: {legend_path}")

    print("\n=== 处理完成 ===")

if __name__ == "__main__":
    main()
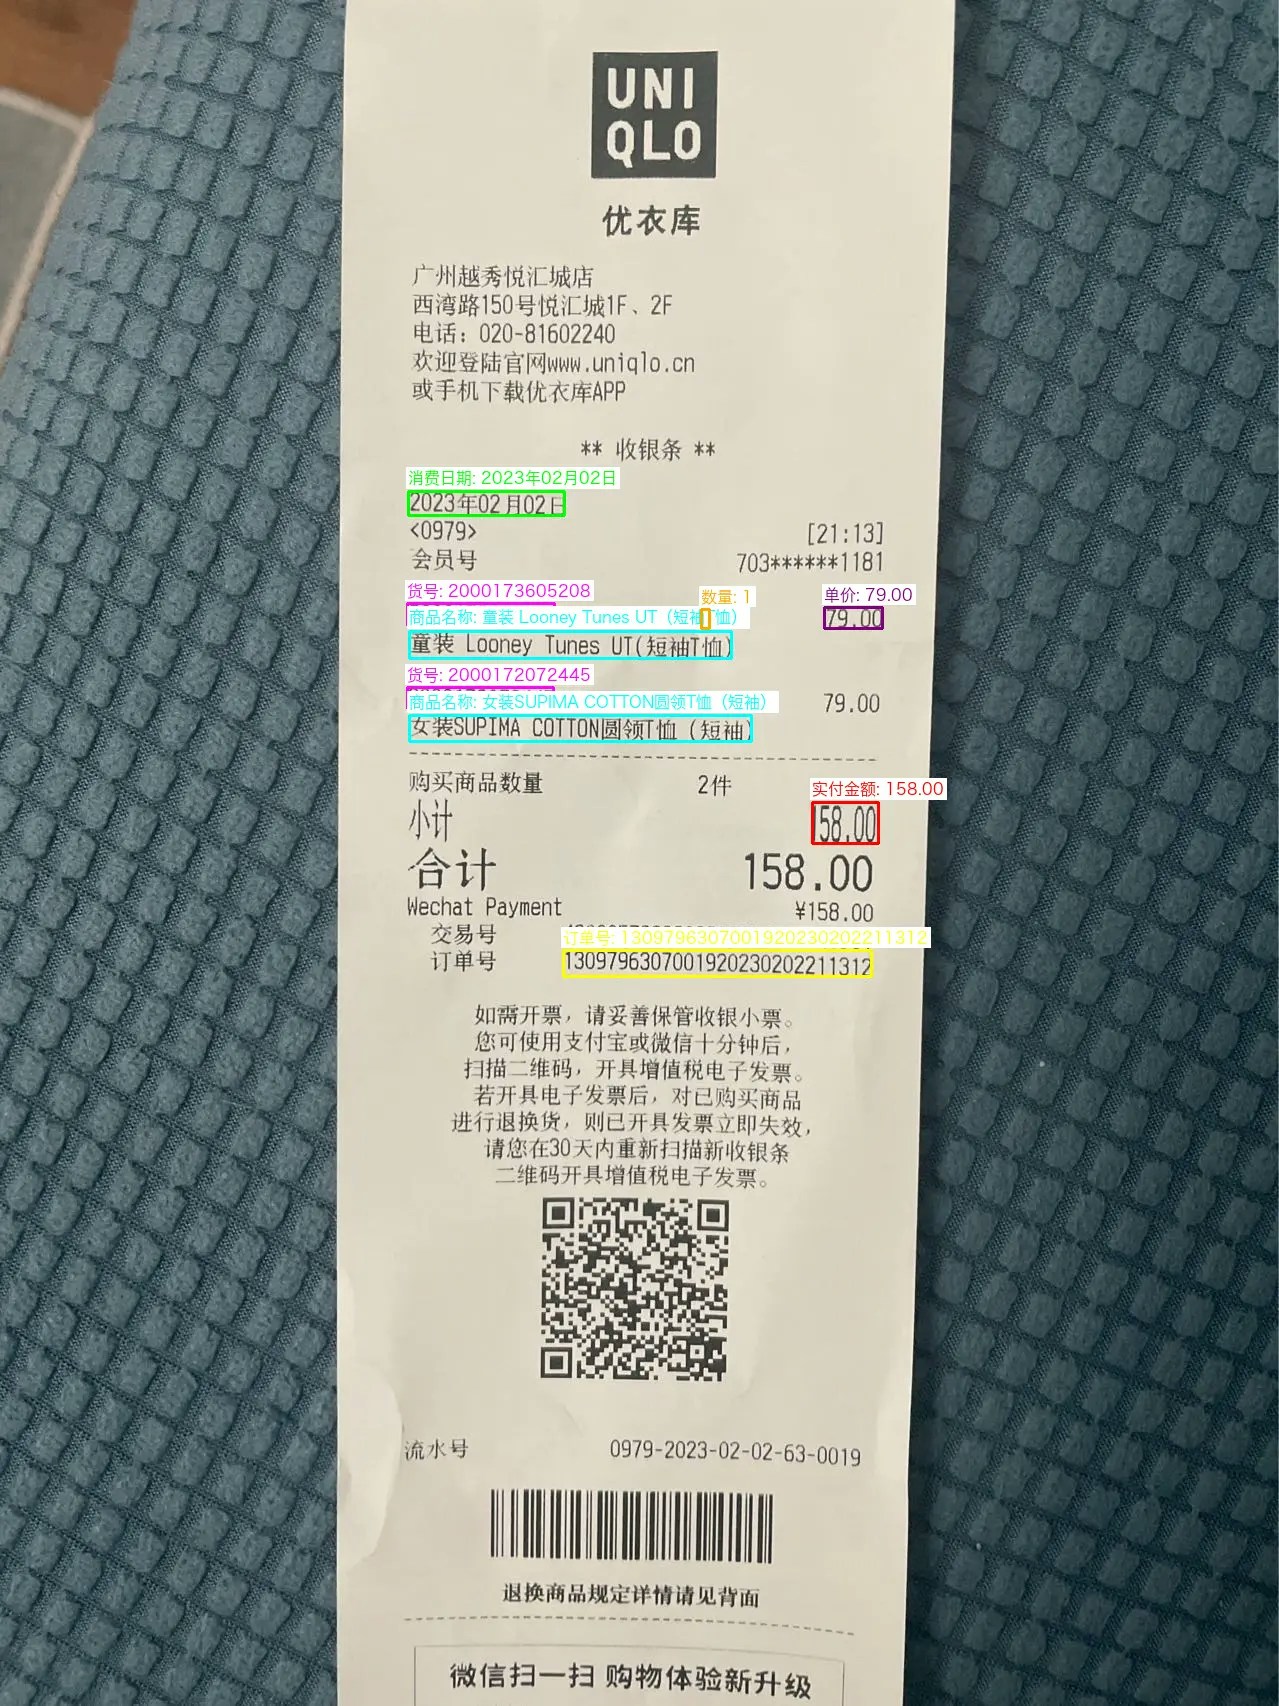
输出效果
运行上述代码后,将得到:- 标注后的图片 (annotated_extract_result.png):在原图上绘制彩色边框显示每个抽取字段的位置
- 图例文件 (legend.png):显示不同字段对应的颜色